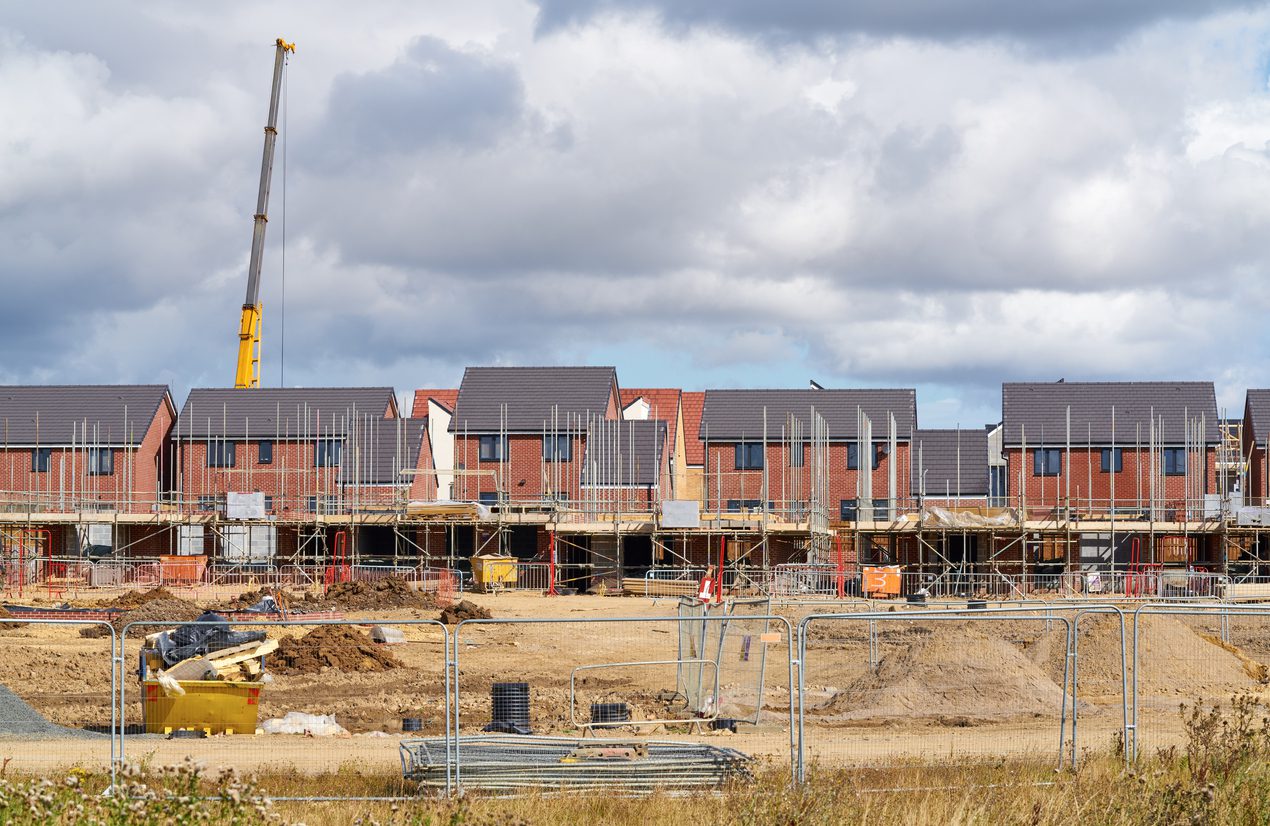
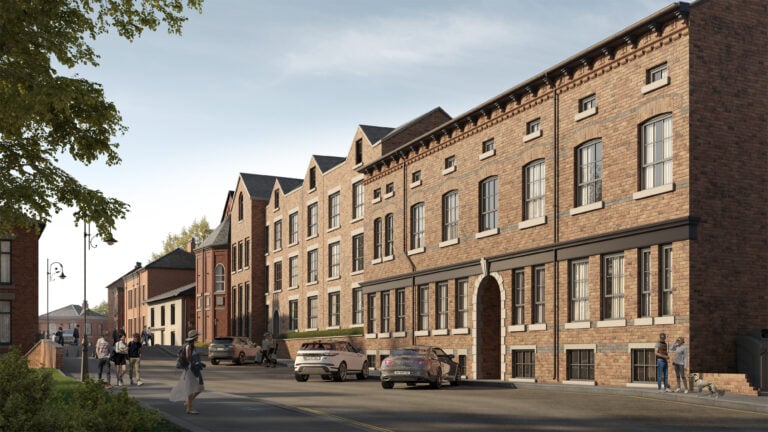
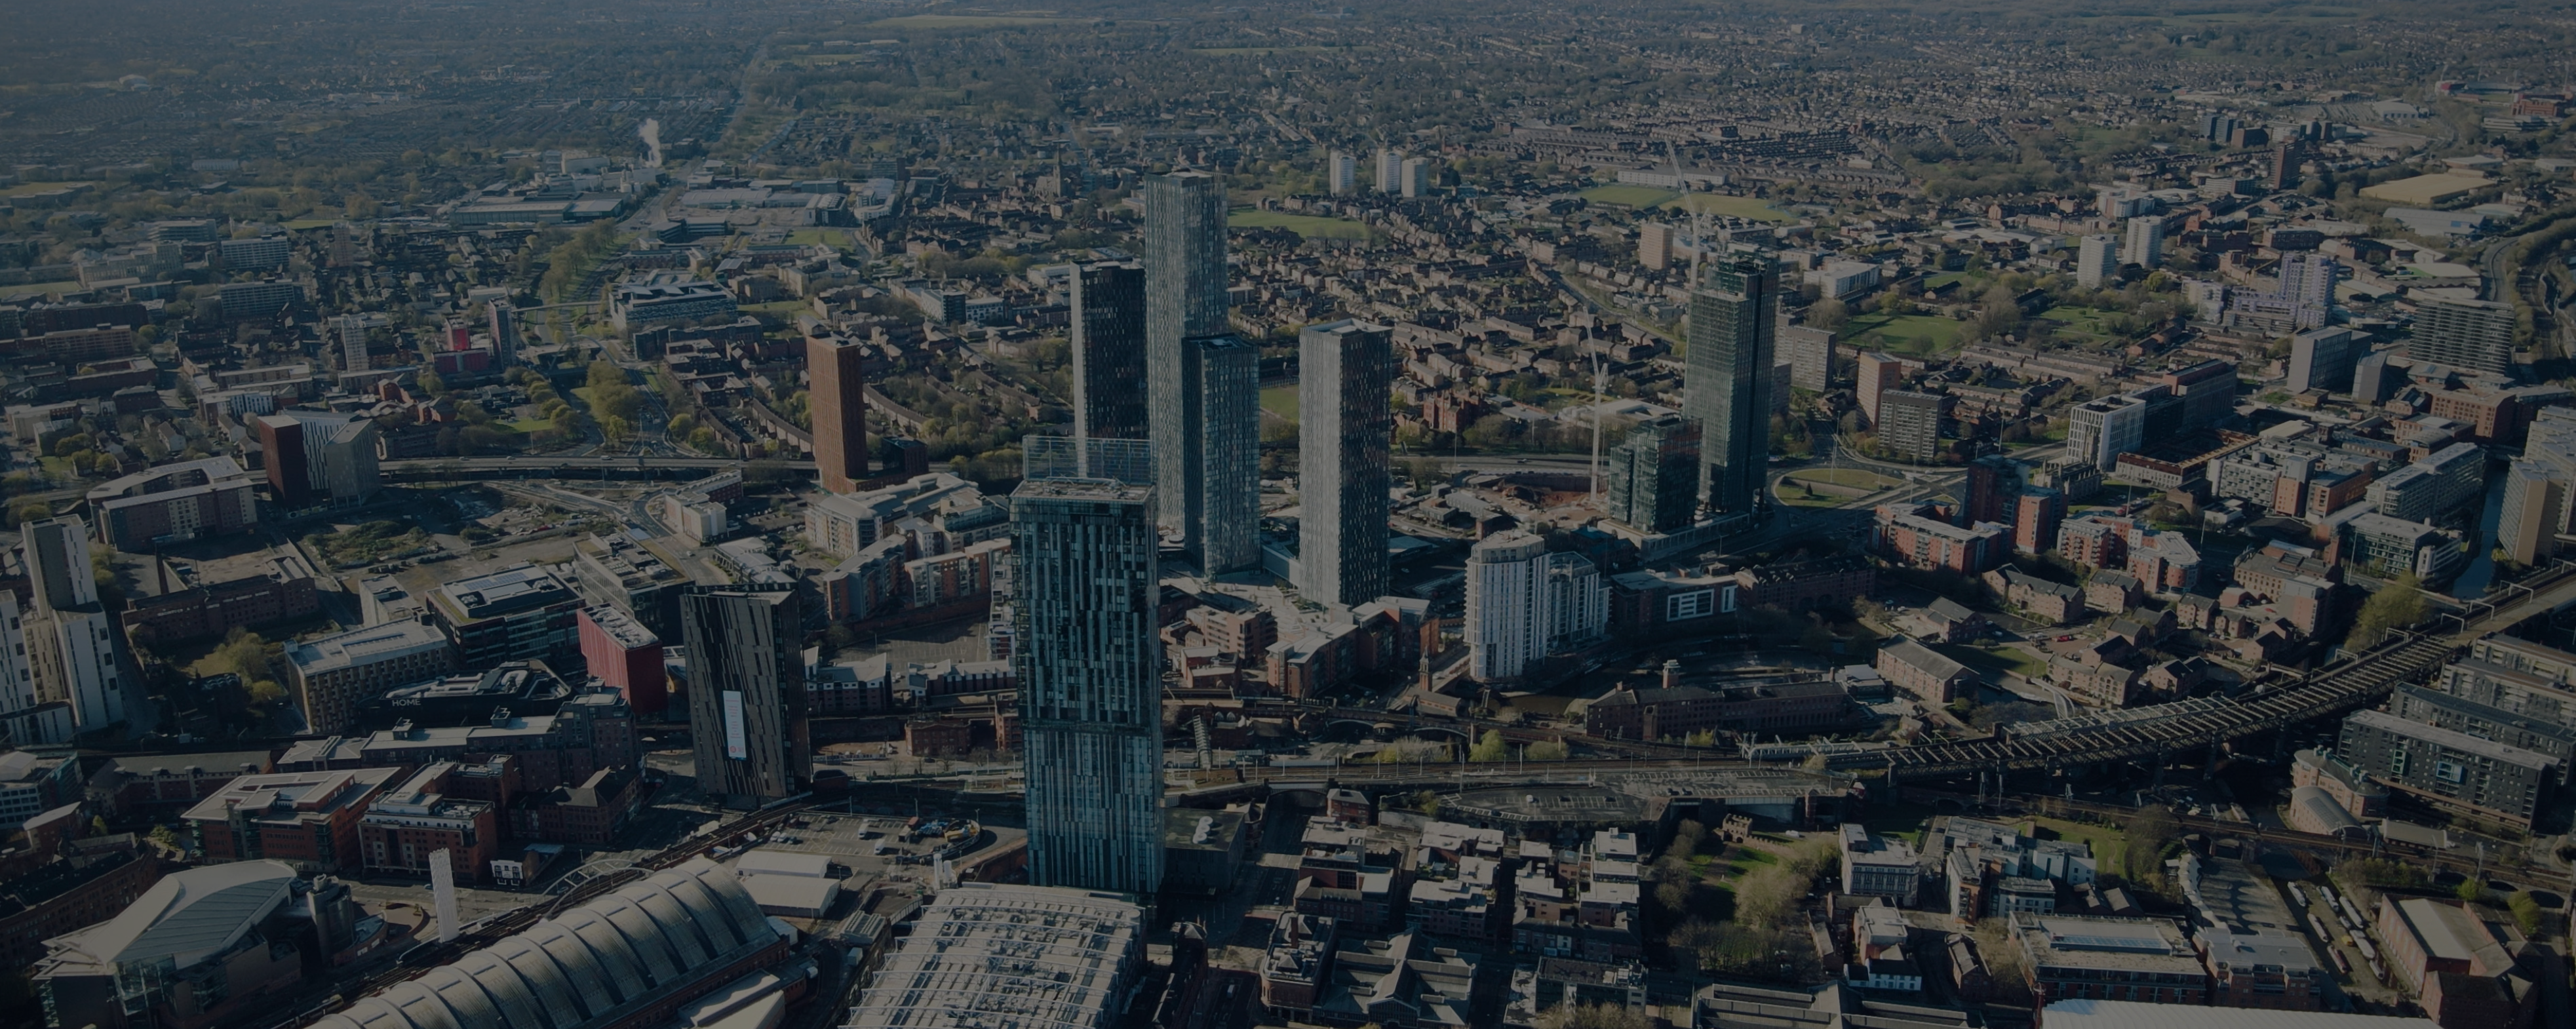
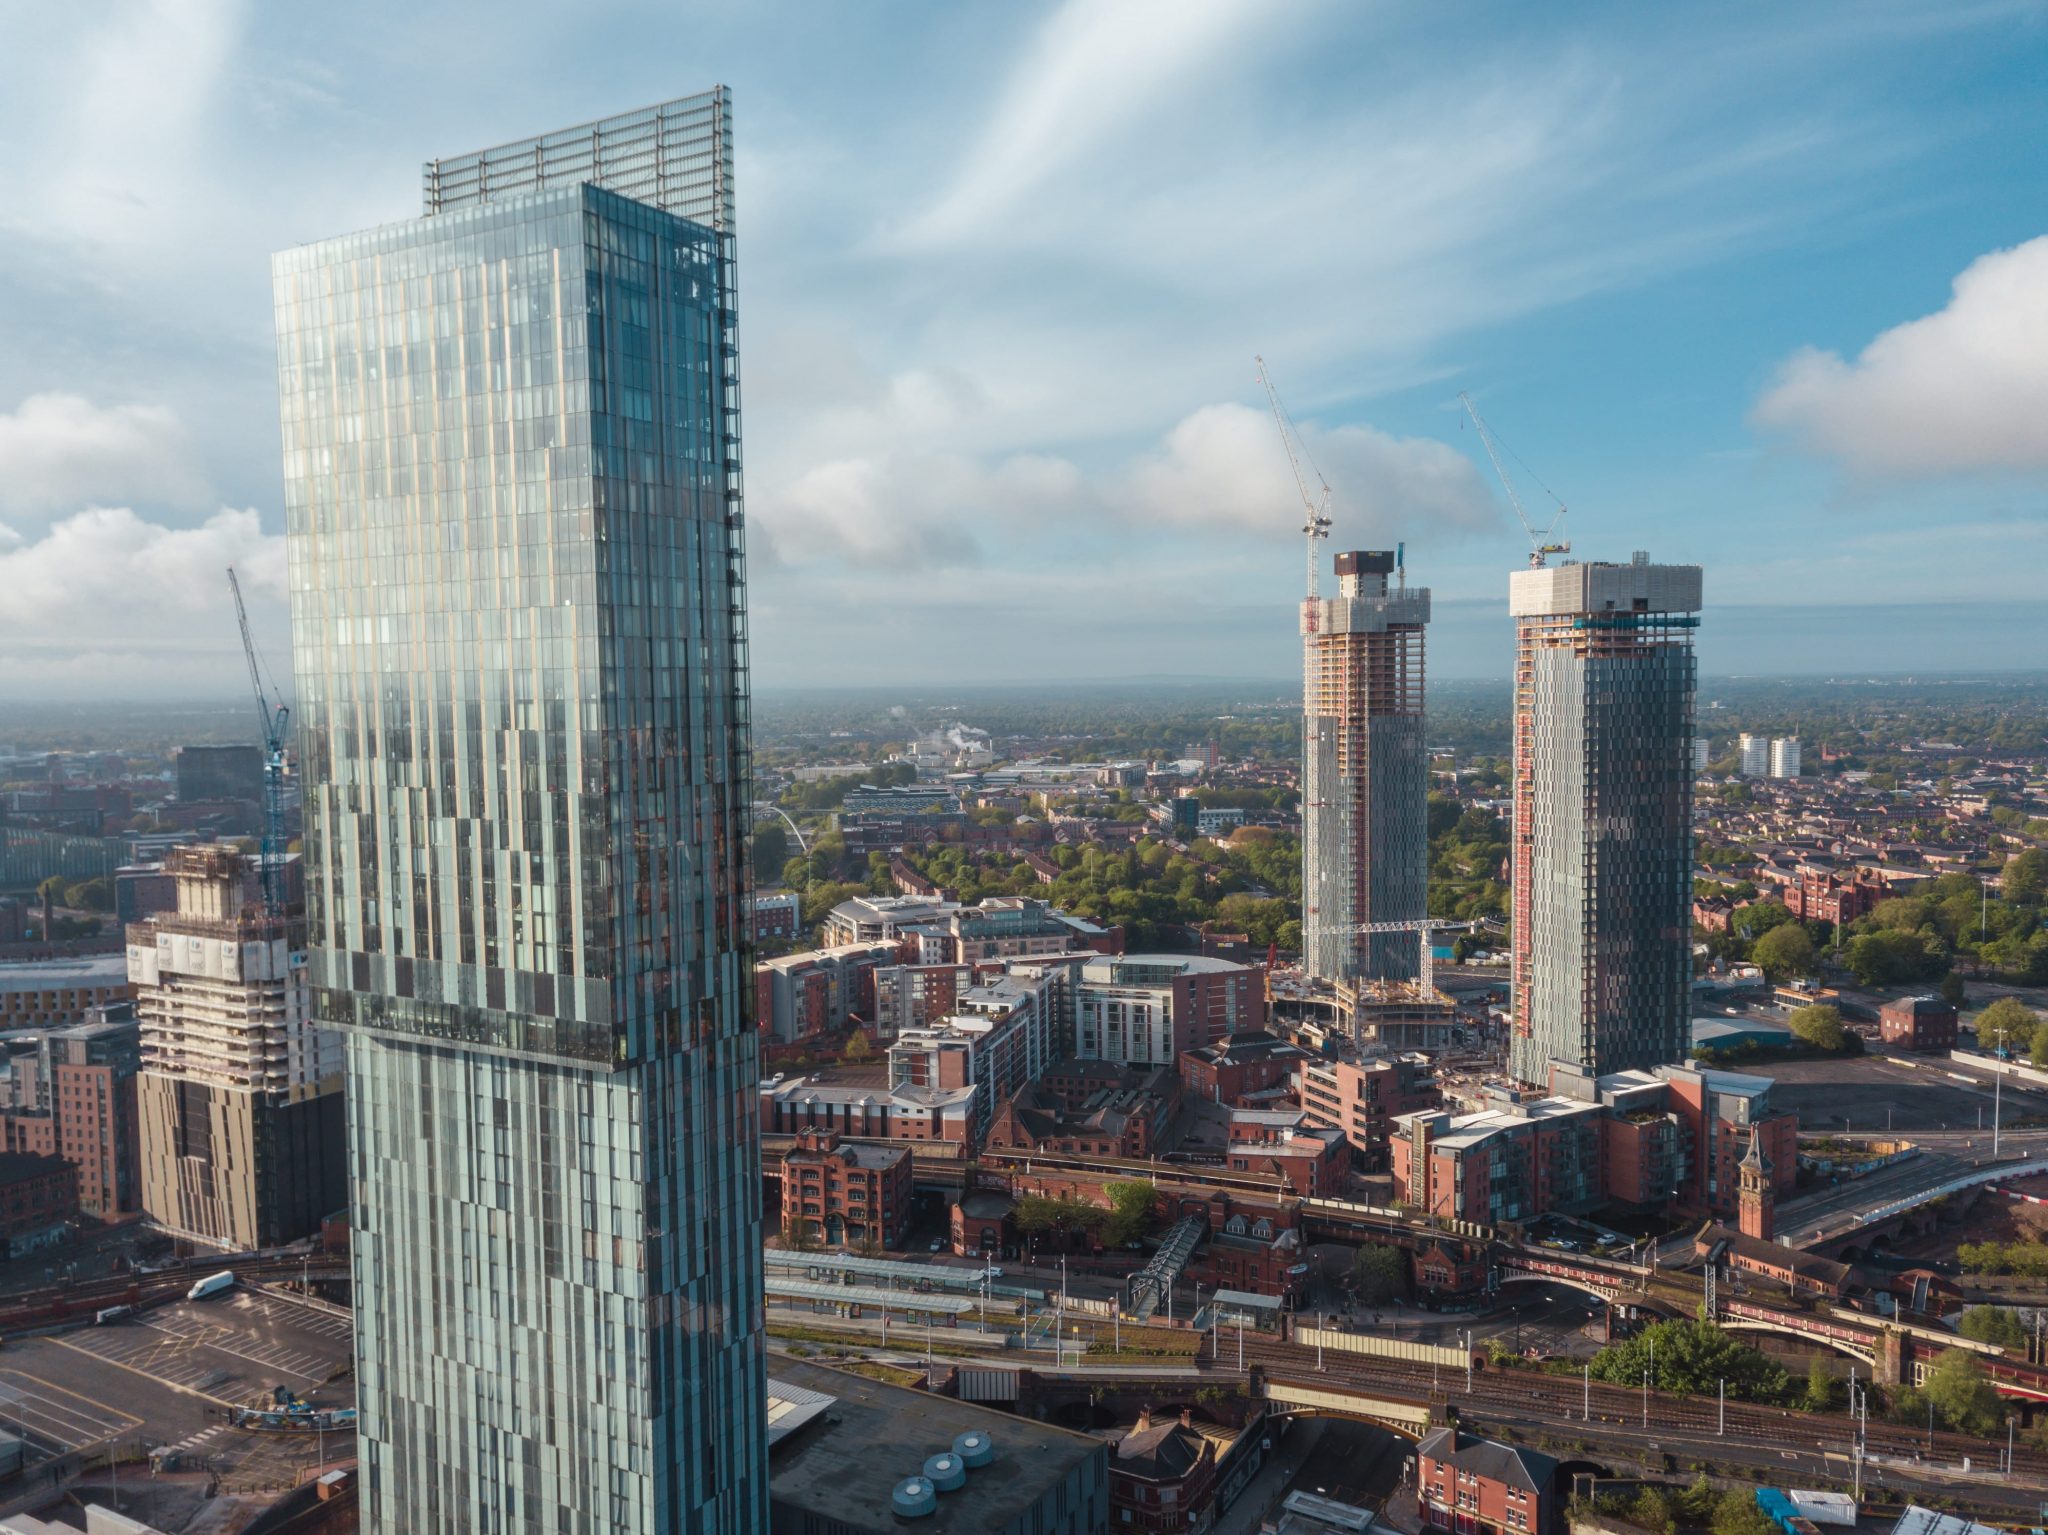
Housebuilding in the UK has definitely been going in the right direction, and there are some interesting regional differences in both quantity and size.
Between 2018 and 2019, UK housebuilders successfully delivered 203,900 new homes. The average property houses 2.4 people meaning homes were built for around 483,243 people.
The UK population is estimated to have risen by 395,321 over the same time scale which, means housebuilders successfully built new homes for an extra 88,000 people.
This oversupply was at its largest in England, with enough homes built for an additional 43,000 people when compared to the increase in population. In Scotland, there were enough for an additional 37,000 people, with nearly 8,000 in Northern Ireland and just 200 in Wales.
There has been ongoing debate about the need for a greater supply of new-build homes across the UK. A growing singleton population and lack of affordability causing young people to live with parents has fuelled a demand for more homes.
New homes built each year more than doubled
As it stands, there has been a significant improvement from 2012-2013 when the target more than doubled with a new home target of 130,000. Now around 247,000 more houses are being constructed in England and Wales which is not far off the ambitious government target of 300,000 new homes per annum.
According to the Ministry of Housing Communities and Local Government’s (MHCLG) ‘Housing Delivery Targets 2019’ data, in total, 34% of local authorities fell short of meeting their housing targets for 2019.
Regionally the supply of new housing varies, and research from Stone Real Estate reveals how geography and population marry up. The south-east has seen the greatest oversupply with enough properties built to house an additional 23,000 people, when comparing completed dwellings to the increase in population.
Locally, the county of Wiltshire, as well as the cities of Manchester and Milton Keynes, had the most prolific level of housebuilding to meet their growing populations, each supplying enough homes for in excess of over 3,000 additional people.
London’s build rate equivalent to size of both Bristol and Sunderland
The research revealed that London was the only other region to see the population grow at a greater rate than the number of homes completed with a deficit of 37,000. However, the city can claim to have built the highest number of homes, constructing 307,000 since 2011. Tower Hamlets has contributed the most to this overall total, with 23,600.
Westminster was home to the worst shortfall with an additional 10,000 homes required, along with Camden (8,500) and Tower Hamlets (5,400).
Further north, the West Midlands showed an undersupply of some 200 properties.
Coventry was home to the biggest shortfall outside of London at just under 5,000 additional homes required. Sheffield, Wandsworth, Bristol, Birmingham and Brighton were also in the top 10.
Keep building trends going
Founder and CEO of Stone Real Estate, Michael Stone, commented: “We’ve seen a fantastic job done of late by the nation’s homebuilders when it comes to the sheer volume of stock being delivered and when you compare the number of properties being completed in the last 12 months to the increase in population on a national level, this achievement becomes even more evident.
“However, this isn’t the case everywhere and the draw of living in London and other larger cities, coupled with a lack of space to build on, has resulted in some areas fall behind in terms of the new homes being built compared to the increase in population.”
“It’s important we keep out foot on the gas and keep meeting demand with new-build supply as not only do we need to build more houses in some areas based on the last year alone, but we were already starting on the back foot due to fewer homes being built in previous years.
“Of course, this underperformance can’t be placed solely at the doors of the industry’s developers, far from it. The real spanner in the works over recent years has been a lack of commitment by the government to actually let developers build, as well as a failure to free up land that has been wrongly designated as green belt and could serve a much better purpose meeting the appetite for homes across the UK property sector.”
City living is key
Centre for Cities, a leading think tank dedicated to improving the economies of the UK’s largest cities and towns, confirmed that about 803,000 new homes were mainly built in large towns and cities between 2011 and 2019; defined as places with a daytime population of at least 135,000.
Their findings showed of the 803,000, the majority (734,000) were built in the suburbs, about 69,000 are based in the city centres, which is an increase of 16 per cent over the past eight years, compared to an overall rise of 6% for England and Wales.
Size makes a difference
There’s a north-south divide when it comes to the size of the new homes being built. In the north, in general, the findings found the new-build properties tended to be much bigger than in the south. Unsurprisingly, the north of England is where you get more for your money – and those looking for a bit more space for their next home might consider joining the exodus away from London towards the north.
Among large towns and cities, Blackpool built the largest homes, at 101 sq m, while Luton built the smallest, at 62 sq m.
It’s also worth pointing out that there is a difference in the actual size of a new home when comparing it against an existing home. An average new home is 92 sq m (990 sq ft), whereas an existing home is 89 sq m – however, there is disparity across the country. Newly built homes in cities were smallest at 64 sq m, but outside city centres they averaged 101 sqm.
