The level of deprivation in London has improved over the last four years, as gentrification spreads across the capital and quality of life improves.
The latest English Indices of Deprivation report for 2019 (IoD2019) from the Office for National Statistics has identified a sharp downward shift in deprivation across some areas of London since the last analysis in 2015.
The boroughs of Westminster, Islington and Tower Hamlets have all shown significant dilution in their deprivation status. This suggests that the neighbourhoods within the authority have become less deprived relative to other neighbourhoods in England.
The gentrification effect in London boroughs
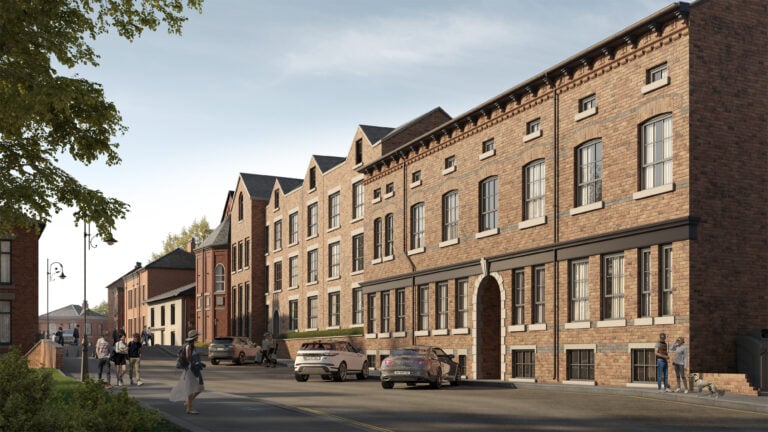
The increase in prosperity in regenerated neighbourhoods can be accounted for to a degree by the influx of wealthy incomers moving into new-build developments. Over the last few years, this has triggered a radical transformation in the socio-economic profile of what were formerly some of London’s most deprived and run down areas.
For example, Tower Hamlets has improved its ranking from 24 in 2015 to 175 in this year’s analysis. Only 1.4% of its neighbourhoods were in the 10% most deprived in England compared with 55% in 2004.
In Islington, 15 years ago, a third of neighbourhoods were classified as among the most deprived; now that stands at 5%. In Hackney, where nearly 50% of neighbourhoods were in the top 10% most deprived in 2004, just one in 10 now were.
Number of deprived areas in London falls from eight to three
Four years ago, when looking at the proportion of their neighbourhoods which were the most deprived nationally, the IoD2015 report ranked eight London boroughs in the most deprived 30% of local authorities – Tower Hamlets, Haringey, Hackney, Islington, Westminster, Enfield, Kensington and Chelsea and Waltham Forest.
Now only three London boroughs are ranked in the most deprived three deciles: Hackney, Haringey and surprisingly Kensington and Chelsea – its demographic one of two halves.
London has seven of the 10 local authority districts with the highest levels of income deprivation among older people, unchanged from the IoD2015.
Seven distinct domains, which are combined and weighted accordingly, measure the degree (or not) of deprivation attributed to each area. They are: – Income (22.5%) – Employment (22.5%) – Health Deprivation and Disability (13.5%) – Education, Skills Training (13.5%) – Crime (9.3%) – Barriers to Housing and Services (9.3%) – Living Environment (9.3%).
How the rest of the country fares
Across England, 88% of neighbourhoods that are in the most deprived decile in the 2019 Index of Multiple Deprivation 2019 were also the most deprived according to the IoD2015. Across 61% of England’s local authority districts, at least one includes one of the most deprived neighbourhoods.
Middlesbrough, Liverpool, Knowsley, Kingston upon Hull and Manchester are the local authorities with the highest proportions of neighbourhoods among the most deprived in England.
Middlesbrough and Blackpool rank as the most deprived districts regarding income deprivation among children.
The IoD2019 report is based on the collation of key information in 32,844 small neighbourhoods, termed ‘Lower-layer Super Output areas’ across England.
The ONS said: “It is important to remember that many non-deprived people live in deprived areas, and many deprived people live in non-deprived areas. The IoD2019 is designed to identify and measure specific aspects of deprivation, rather than measures of affluence.”


